

Visualizing Insights for the growth of your company
Our data visualization service transforms raw data into clear, actionable insights—helping you make confident decisions without the need for complex spreadsheets or reports.
By connecting directly to your data sources, we create real-time dashboards and visual reports that give you a clear view of your business at any moment. Easy to use and built for all teams, these tools help you track performance, spot trends, and quickly share insights across your organization.
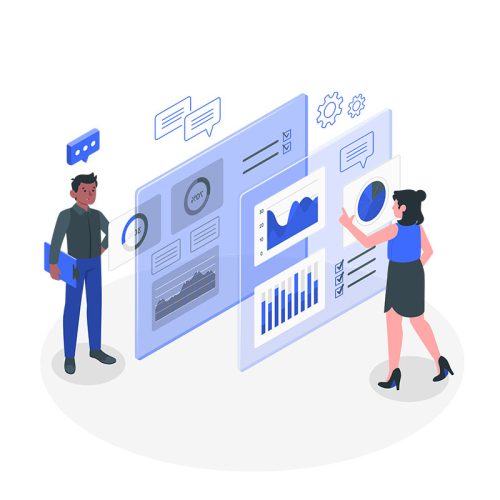
How we visualize your data
Our approach combines interactive and real-time dashboards, AI-driven insights, and clear storytelling to help you see what matters most.
Interactive Dashboards
Customizable, real-time dashboards give you a unified view of your most critical business metrics — from sales performance and customer behavior to inventory levels and marketing ROI. Built with drag-and-drop simplicity, dashboards can be tailored to each team's needs, ensuring that the right people always have the right data in front of them without having to dig through multiple systems or reports.
AI-Powered Reporting
Automated reporting tools leverage AI to not only generate scheduled visual reports but also highlight anomalies, trends, and patterns that might otherwise go unnoticed. Rather than simply presenting data, the platform surfaces context-aware insights and natural language summaries alongside visuals — translating numbers into clear narratives that explain what happened, why it matters, and what action to consider next.
Data Story Telling & Predictive Visuals
Beyond static charts, our platform enables forward-looking visualization by overlaying predictive analytics onto historical data, helping businesses anticipate future trends rather than just reviewing the past. Visuals are designed to tell a coherent story — guiding stakeholders through a logical flow of insight from problem identification to recommended action — making data a powerful communication tool both internally and with clients or investors.
See Your Business Clearly!
Most small businesses are sitting on a goldmine of data they can’t fully read. Our data visualization service changes that by turning raw numbers into vivid, real-time visual narratives that anyone on your team can understand and act on — no spreadsheets, no analysts, no guesswork.
- Most small businesses are sitting on a goldmine of data they can't fully read. Our data visualization service changes that by turning raw numbers into vivid, real-time visual narratives that anyone on your team can understand and act on — no spreadsheets, no analysts, no guesswork.
- Spot Opportunities Before They Pass — AI-powered reporting automatically surfaces trends, anomalies, and patterns your team would otherwise miss.
- Communicate with Confidence — Visual stories and natural language summaries make it easy to share insights with your team, clients, or investors in seconds.
- Stop Reacting, Start Predicting — Predictive visuals overlay future trends onto historical data so you can make proactive decisions, not reactive ones.
- Built for Every Team Member — Drag-and-drop simplicity means anyone — regardless of technical skill — can explore and act on data independently.
In today’s fast-moving market, the businesses that grow are the ones that truly understand what’s happening inside their operations and what’s coming next. Our visualization platform gives your team that clarity- transforming data from a passive record into your sharpest strategic advantage.